The info you are looking for can’t be found.
You may want to try our search bar or explore our latest resources.
Latest Resources
Erfahren Sie, wie Data Cloud mit Zero-Copy-Integration das Geschäftswachstum aktiviert.
Verwandeln...
Download our Comprehensive Guide on Essential Components for HVAC Systems
As a manufacturer of air-handling...
How to pick the right small business firewall
Future-Proof Your Business with the Right Firewall Solution
In...
[POV] Why Users Need Network and Security Convergence
Empower Your Workforce with a Smarter, More Reliable...
Deliver actionable insights everywhere work happens
Tableau Next is the world’s first agentic analytics...
AI agents. Revenue strategies. Explore the latest trends in “State of Sales.”
Get the sales statistics,...
Beyond Dashboards: Unlock Trusted Conversational Analytics with Tableau Next
On-Demand Webinar
Unlock...
What is Tableau?
Tableau offers a suite of agentic analytics and AI-powered business intelligence tools,...
Learn how leaner sales tech stacks lead to stronger AI.
It's easy to add quick-hitting AI tools to your...
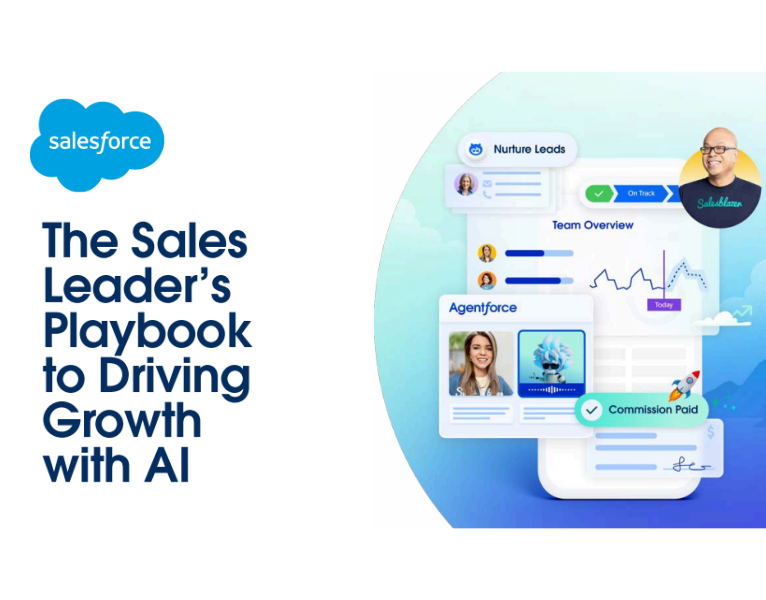
Get the Playbook: 5 Ways to Scale Your Sales Team with Agents.
Closing a deal will always come down...
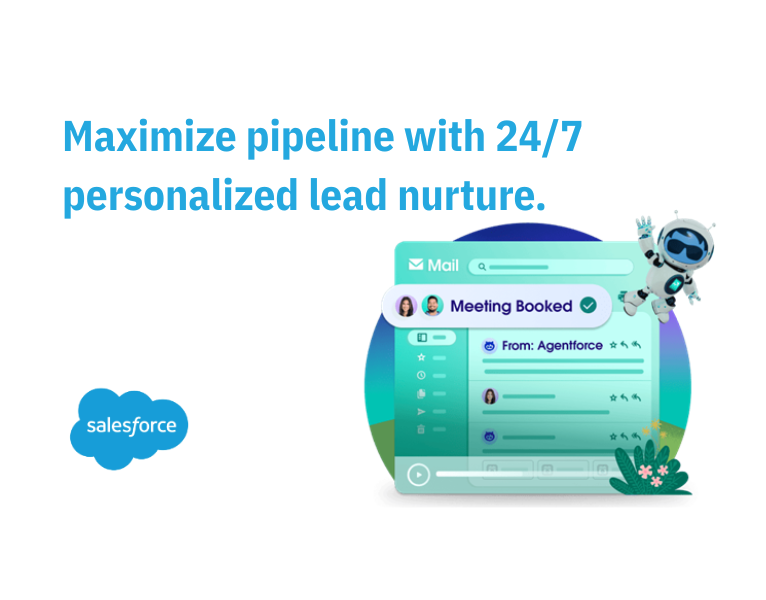
Maximize pipeline with 24/7 personalized lead nurture.
Say hello to your new digital workforce. With...
Salesforce named as a Leader for SFA in the 2025 Gartner® Magic Quadrant™
We’re thrilled to be named...


![[POV] Why Users Need Network and Security Convergence](https://softwaretrends.com/wp-content/uploads/2025/11/POV-Why-Users-Need-Network-and-Security-Convergence.png)


